Soil compaction is the invisible foundation beneath every road, building, dam, and pipeline in America. Get it right, and a structure performs flawlessly for generations. Get it wrong, and you're looking at differential settlement, pavement failure, costly rework, and potentially catastrophic structural damage. The construction industry has historically relied on spot-check testing—a nuclear density gauge here, a sand cone test there—to verify compaction quality. But in 2026, that paradigm is being rapidly replaced by continuous, GPS-referenced, data-driven compaction monitoring that captures what's happening under every pass of a compactor roller, in real time.
For earthwork contractors, understanding this technology landscape isn't just about staying current. It's about winning contracts, reducing liability, cutting rework costs, and delivering projects that pass inspection the first time. This guide covers every major compaction monitoring method, the regulatory and standards frameworks that govern them, real-world cost and efficiency data, and what the next generation of intelligent compaction systems looks like heading into the second half of the decade.
Why Compaction Monitoring Matters More Than Ever in 2026
The stakes for earthwork quality control have never been higher. The U.S. construction industry is spending over $2.1 trillion annually according to the latest U.S. Census Bureau construction spending data, with a significant share directed at infrastructure rehabilitation—roads, bridges, and earthen embankments that were built with older quality control standards and are now failing prematurely.
Settlement-related failures account for an estimated 25–40% of all structural damage claims in the construction industry. When investigators trace those failures back to root cause, inadequate or inconsistently monitored soil compaction appears in the majority of cases. The financial consequences are severe: rework on a single highway embankment section can run $500,000 to $2 million depending on depth and extent of the problem. On a large earthen dam or levee, the costs multiply exponentially—and the safety consequences can be catastrophic.
Regulatory pressure has also intensified. State DOTs now routinely require documented, continuous compaction records as a condition of project acceptance. Federal infrastructure projects funded under the Infrastructure Investment and Jobs Act include compaction verification requirements that many traditional spot-check methods struggle to satisfy at scale. Owners and engineers of record are increasingly demanding intelligent compaction (IC) data submittals as part of quality assurance packages.
Meanwhile, the labor shortage in construction—with the Bureau of Labor Statistics projecting ongoing workforce gaps in extraction and construction occupations—means that contractors can't always rely on having experienced field technicians running density gauges on every lift of every fill. Technology that automates and continuously monitors compaction is no longer a luxury for large contractors. It's becoming an operational necessity.
For contractors managing large earthwork volumes, finding the right soil materials is just as important as compacting them correctly. Platforms like DirtMatch connect earthwork contractors with verified sources for fill dirt, aggregate, and other compactable materials, helping teams source the right soil type for their compaction specifications before the first roller pass ever happens.
The Foundation: Understanding Soil Compaction Mechanics
Before diving into monitoring technology, it's worth grounding ourselves in what compaction actually does to soil and why measuring it correctly is so technically demanding.
Compaction is the process of mechanically increasing the dry density of soil by reducing the air voids between soil particles. It does not remove water from soil (that's consolidation, a separate phenomenon). Instead, compaction rearranges soil particles into a denser, more stable configuration that increases load-bearing capacity, reduces permeability, and minimizes future settlement.
The Proctor Test and Optimum Moisture Content
The cornerstone of all modern compaction specifications is the Proctor compaction test, standardized as ASTM D698 (Standard Proctor) and ASTM D1557 (Modified Proctor). These tests establish the maximum dry density and optimum moisture content for a specific soil under defined compactive effort. Modified Proctor uses 4.5 times more compactive effort than Standard Proctor, making it more appropriate for highway and airfield subgrade work where heavy loading is anticipated.
The relationship between moisture content and compaction density is a bell curve: too dry, and particles can't slide past each other to compact efficiently; too wet, and water in the pore spaces prevents particles from reaching high density. Every soil has its own unique curve, which is why laboratory Proctor testing of actual project soils—not assumed values—is essential before fieldwork begins.
Compaction Specifications in Practice
Most project specifications require field compaction to reach a minimum percentage of laboratory maximum dry density—typically 90–95% for general fills, 95–98% for subgrade, and up to 100% for select fills under critical structures. These requirements are expressed as Relative Compaction = (Field Dry Density / Maximum Dry Density from Proctor) × 100.
Meeting these specifications consistently across thousands of cubic yards of fill, across varying soil types and moisture conditions, lift thicknesses, and roller patterns, is where compaction monitoring technology earns its value.
Traditional Compaction Testing Methods: Nuclear Density Gauges and Sand Cone Tests
For most of the 20th century, compaction quality control relied on two primary field methods: the nuclear density gauge and the sand cone test. Understanding these methods—and their limitations—explains why the industry has been so eager to adopt newer technologies.
Nuclear Density Gauge (ASTM D6938)
The nuclear moisture-density gauge has been the workhorse of compaction testing for over 50 years. It uses a cesium-137 gamma source to measure the attenuation of gamma rays through soil, which correlates to dry density, and an americium-241/beryllium neutron source to measure hydrogen content (a proxy for moisture). Readings are fast—typically 1–4 minutes—and the device provides both moisture and density in a single operation.
Advantages:
- Rapid field results
- Non-destructive (no excavation required)
- Provides moisture and density simultaneously
- Well understood by inspectors and engineers
Limitations:
- Spot measurements only—a single test covers roughly a 6-inch radius
- Requires licensed operators and radioactive material permits in most states
- Subject to surface preparation effects and aggregate interference
- Testing frequency is typically 1 test per 500–2,500 square feet, leaving vast areas unverified
- Gauge response varies with soil mineralogy, particularly soils with high iron content or volcanic materials
Sand Cone Test (ASTM D1556)
The sand cone is the original gold standard—a direct measurement method that determines in-place density by excavating a small hole, measuring the volume of the hole with calibrated Ottawa sand, and weighing the excavated soil. It's entirely free of calibration assumptions and requires no radiation licensing.
However, it's slow (30–60 minutes per test), labor-intensive, requires laboratory backup for moisture determination, and is genuinely impractical for high-production earthwork operations. On a project placing 5,000 cubic yards per day, sand cone testing will always be a statistically inadequate sample of what was actually compacted.
The Fundamental Problem with Spot Testing
Both of these methods share a critical flaw: they're sampling a tiny fraction of the total compacted area and inferring overall quality from those few data points. Research from multiple state DOTs has consistently found that problem zones—areas of inadequate compaction—are often located precisely between test points, in areas that are difficult to access with rollers, or in lift transitions. Spot testing simply cannot catch these systematically.
Intelligent Compaction: The GPS-Integrated Revolution
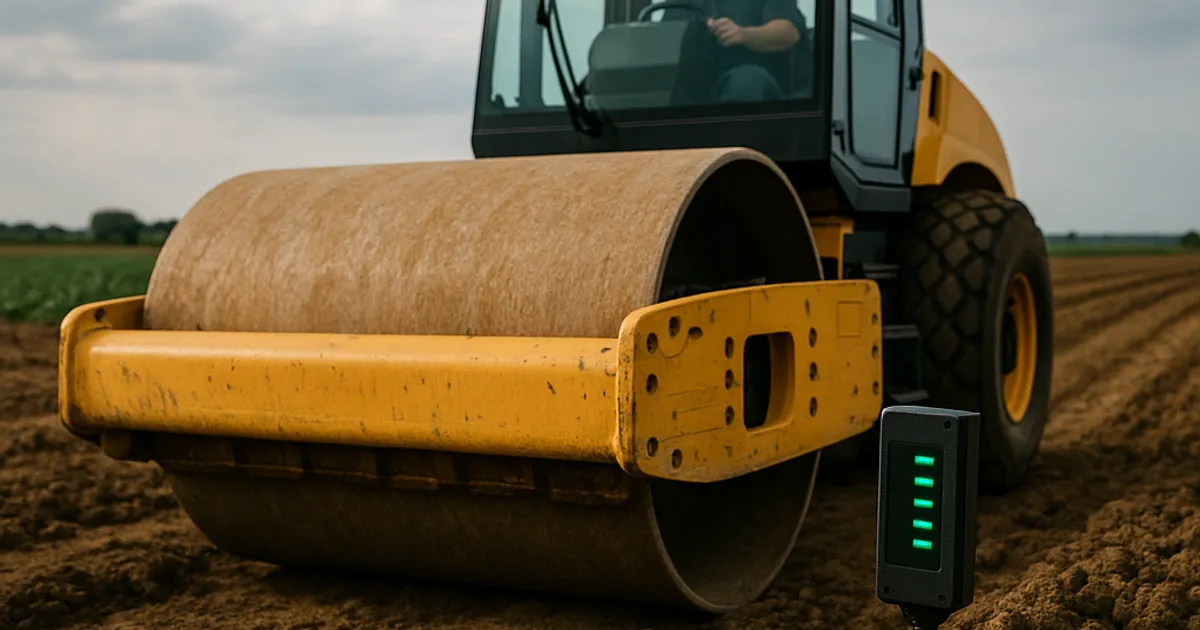
Intelligent compaction (IC) technology represents the most significant advancement in earthwork quality control in the past 50 years. IC systems integrate GPS positioning, accelerometer-based compaction measurement, and onboard computing to create a continuous, real-time map of compaction conditions across every square foot of a project.
How Intelligent Compaction Systems Work
An IC-equipped vibratory roller carries several integrated components:
- GPS/GNSS Receiver — Provides centimeter-level positioning of the roller drum at all times, typically updated 10–25 times per second.
- Accelerometers on the Drum — Measure the dynamic response of the drum as it interacts with the soil. Stiffer, better-compacted soil returns more energy to the drum; softer or looser soil absorbs more energy.
- Compaction Meter Value (CMV) or Compaction Control Value (CCV) — Proprietary algorithms (which vary by manufacturer) process the accelerometer data to produce a dimensionless stiffness index. Higher values generally indicate greater soil stiffness and compaction.
- Onboard Display — Shows the operator a real-time color-coded map of the compaction pass, highlighting areas of low stiffness that may need additional passes.
- Data Logger — Records all GPS coordinates, CMV/CCV values, roller speed, vibration frequency, amplitude, and pass count to a timestamped data file.
The result is a complete spatial record of compaction conditions, analogous to a heat map, that documents every pass across the entire project footprint.
IC Standards and FHWA Implementation
The Federal Highway Administration has actively promoted intelligent compaction adoption through its IC pooled fund study and the development of standardized IC specifications. As of 2026, over 35 states have developed IC specifications or pilot programs for highway earthwork and pavement base compaction. AASHTO has published provisional standards for IC documentation and data interpretation, and ASTM International has developed ASTM E2835 for measuring stiffness response of pavement systems using IC rollers.
Key IC implementation requirements typically include:
- Calibration correlations between IC meter values and traditional density test results
- Minimum GPS accuracy requirements (typically ±10 cm horizontal)
- Maximum roller speed during IC measurement passes (often 3–5 km/h)
- Data format specifications for project deliverables (often using the LandXML IC data schema)
Manufacturer IC Systems: A Comparison
Several major equipment manufacturers offer IC-equipped roller systems with proprietary measurement technologies:
| Manufacturer | IC System Name | Compaction Metric | Key Features |
|---|---|---|---|
| Caterpillar | CAT Compaction Control | CMV (Compaction Meter Value) | Integrated with Cat Grade/VisionLink telematics |
| Komatsu | iMC (Intelligent Machine Control) | CCV (Compaction Control Value) | Automatic amplitude/frequency adjustment |
| Dynapac | Dynapac Compaction Analyzer (DCA) | CMV + RMV (Resonance Meter Value) | Drum jump detection, bounce prevention |
| HAMM | HAMM Compaction Meter (HCM) | Omega value | Continuous compaction control (CCC) |
| Volvo | Volvo Compact Assist | CMV | Integrated with Volvo Co-Pilot display |
Note that CMV values are not directly comparable across manufacturers—each proprietary algorithm produces different numerical scales. Cross-manufacturer calibration is an ongoing challenge that the industry is working to address through standardization efforts.
Continuous Compaction Control vs. Intelligent Compaction: Understanding the Distinction
Intelligent compaction and Continuous Compaction Control (CCC) are related but distinct concepts that are often confused in practice.
Continuous Compaction Control (CCC) is the broader concept—using real-time roller-integrated measurement to guide compaction operations. CCC has been practiced in Europe, particularly in Germany and Austria, since the 1980s under standards like ÖNORM B 4420 and ZTV E-StB.
Intelligent Compaction (IC) as defined by FHWA specifically requires GPS positioning integrated with the compaction measurement, enabling spatial documentation. CCC systems without GPS provide real-time feedback to the operator but don't create the spatial record that IC systems produce.
For quality assurance documentation on publicly funded projects, IC (with GPS) is typically required. For contractor-managed quality control on private projects, CCC-only systems may be sufficient and are often more cost-effective for smaller operations.
Emerging Technology: Machine Learning and Predictive Compaction
The most exciting developments in compaction monitoring in 2026 go beyond real-time measurement into predictive and adaptive systems that use artificial intelligence to optimize the compaction process itself.
Adaptive Vibration Control
Advanced IC rollers now offer adaptive vibration control—systems that automatically adjust drum vibration amplitude and frequency in response to real-time stiffness measurements. Instead of operating at a fixed setting and relying on the operator to make adjustments, adaptive rollers automatically optimize their energy input to achieve maximum compaction efficiency without over-compacting (which can cause aggregate breakdown or soil structure damage).
Komatsu's iMC 2.0 system, for example, integrates this adaptive control with 3D design data, allowing the roller to automatically adjust settings as it transitions between different fill zones, soil types, or required compaction specifications within a single project.
Machine Learning-Based Stiffness Prediction
Research partnerships between state DOTs, universities, and equipment manufacturers have produced machine learning models that can predict in-situ CBR (California Bearing Ratio) and elastic modulus from IC measurement data with surprising accuracy—within 10–15% of direct testing values in controlled studies. These models are trained on site-specific calibration data and can account for soil type variability, moisture fluctuations, and equipment differences.
While these predictive models aren't yet mature enough to replace traditional density verification entirely, they're increasingly being used to target spot testing at the most statistically suspect locations—dramatically improving the efficiency and effectiveness of verification programs.
Drone-Based Compaction Monitoring
UAV (drone) technology is entering the compaction quality control space through a different pathway: surface deformation monitoring. By flying repeated LiDAR or photogrammetry missions over a compaction area between roller passes, drone systems can detect millimeter-scale surface settlement that correlates with the degree of compaction being achieved. This approach is particularly valuable for large earthen embankments where traditional access for gauges is difficult.
Light Weight Deflectometer (LWD) and Dynamic Cone Penetrometer (DCP): Field Verification Tools
Intelligent compaction excels at identifying spatial patterns of compaction variability, but project specifications still require calibration against direct measurement methods. Two devices have emerged as preferred complements to IC: the Light Weight Deflectometer (LWD) and the Dynamic Cone Penetrometer (DCP).
Light Weight Deflectometer (LWD)
The LWD (standardized under ASTM E2835 and various state DOT specifications) drops a known weight onto a plate resting on the soil surface and measures the resulting deflection. From this measurement, it calculates elastic modulus (E_LWD), a stiffness-based parameter that directly aligns with the stiffness values measured by IC systems.
The LWD is fast (1–2 minutes per test), portable, requires no radioactive materials, and produces modulus values that can be directly correlated with IC CMV/CCV readings. Several state DOTs have adopted LWD-based specifications as an alternative or supplement to density-based specifications, arguing that stiffness is actually more relevant to pavement performance than density alone.
Typical LWD modulus targets:
- Subgrade: 20–45 MPa (depending on soil type and design)
- Compacted aggregate base: 80–150 MPa
- Granular subbase: 50–100 MPa
Dynamic Cone Penetrometer (DCP)
The DCP drives a cone through soil using a standardized drop hammer and measures penetration resistance (mm/blow). The DCP Index (DCI) correlates to CBR and can detect weak layers at various depths below the surface—a critical advantage when IC surface measurements may not capture subsurface soft zones.
DCP testing is inexpensive, requires no power source, and can be performed to depths of 800–1000 mm (with rod extension). It's particularly useful for:
- Verifying compaction in thin lift situations where IC signal depth is uncertain
- Identifying soft subgrade pockets before placing structural fill
- Quality control on granular materials where density-based specs are difficult to apply
Find or Post Dirt, Rock & Aggregate
Join thousands of contractors using DirtMatch to buy, sell, and exchange earthwork materials.
Try DirtMatch FreeCompaction Monitoring for Different Soil and Material Types
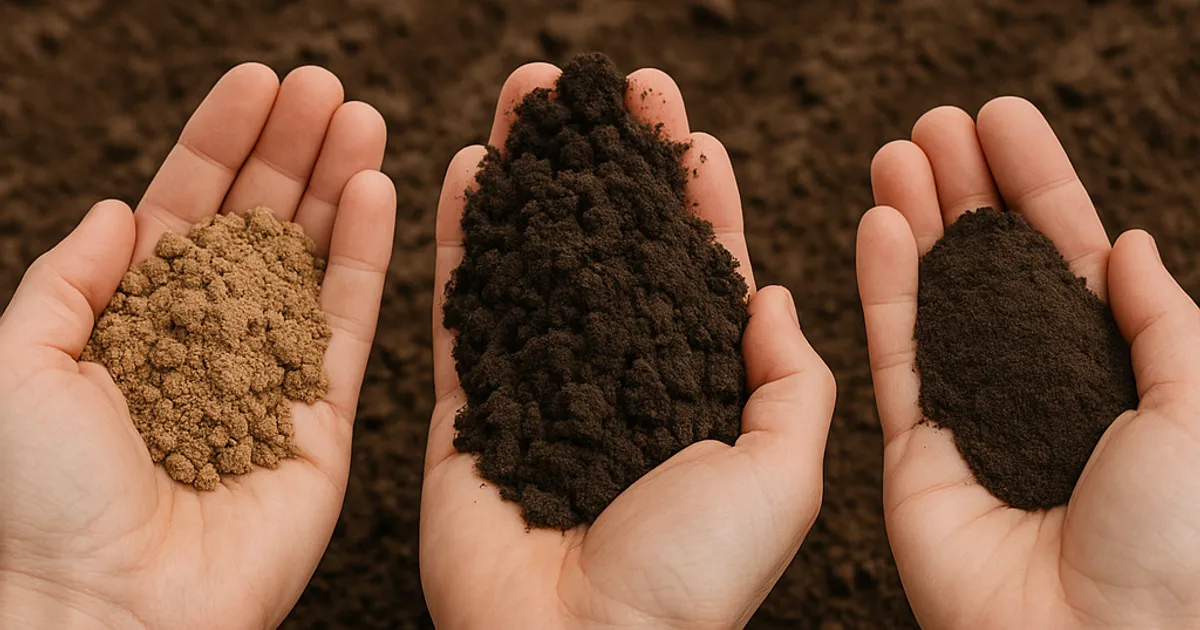
Not all soils respond to compaction—or compaction monitoring—the same way. Understanding the nuances by material type is essential for specifying the right monitoring approach.
Cohesive Soils (Clays and Silts)
Cohesive soils compact through a combination of particle rearrangement and moisture adjustment. They're sensitive to moisture content variation—a clay that is 2% above optimum moisture may achieve very low density regardless of compaction effort. Nuclear density gauges and Proctor-based specifications work well for cohesive soils, but IC systems must be calibrated carefully because wet cohesive soil can give misleadingly low stiffness readings even when density targets are met.
For cohesive fills, moisture monitoring alongside density monitoring is essential. Many IC systems now incorporate ground-penetrating radar (GPR) or time-domain reflectometry (TDR) probes to estimate near-surface moisture content in real time.
Granular Soils (Sands and Gravels)
Granular soils compact more easily and respond very well to vibration. IC systems work particularly well on granular materials, and stiffness-based specifications (LWD modulus or IC CMV targets) are increasingly preferred over density-based approaches for clean granular fills.
One complication: granular soils can exhibit overcompaction if vibration is applied too aggressively, causing grain crushing or particle segregation. IC systems with resonance meter value (RMV) monitoring help detect drum bounce conditions that indicate this risk.
Recycled and Alternative Fill Materials
As sustainability drives increased use of recycled concrete aggregate (RCA), reclaimed asphalt pavement (RAP), and industrial byproducts as structural fill, compaction monitoring becomes more complex. These materials often have variable Proctor characteristics that change as the material weathers or crushes under compaction. Stiffness-based testing (LWD, IC) is often more reliable than density-based testing for recycled materials.
For contractors sourcing alternative fill materials for earthwork projects across regions like dirt exchange in Denver or dirt exchange in Los Angeles, verifying material compaction characteristics before placing large volumes is critical—and the right monitoring technology can catch variability early before it becomes a costly problem.
Regulatory Framework and Standards for Compaction Quality Control
Compaction monitoring doesn't happen in a regulatory vacuum. Understanding the standards and specification landscape is essential for compliance and project acceptance.
ASTM Standards
ASTM International publishes the core laboratory and field test standards for compaction:
- ASTM D698 — Standard Proctor compaction test (standard compactive effort)
- ASTM D1557 — Modified Proctor compaction test (modified compactive effort)
- ASTM D1556 — Sand cone method for in-place density
- ASTM D6938 — Nuclear methods for in-place density and moisture
- ASTM D4253/D4254 — Maximum and minimum density for granular soils (relative density)
- ASTM E2583 — Light Weight Deflectometer measurement of deflection
- ASTM E2835 — Measuring deflection with a portable impulse plate load test device
AASHTO Standards
AASHTO counterpart standards (T 99, T 180, T 310, etc.) mirror many ASTM methods and are typically referenced in state DOT specifications. AASHTO's IC provisional specifications (PP 80, PP 81) provide framework guidance for IC implementation on highway projects.
State DOT Specifications
State DOTs vary significantly in their compaction monitoring requirements. As of 2026:
- California DOT (Caltrans) requires IC documentation on all Caltrans-funded earthwork projects over $5 million
- Minnesota DOT has one of the most mature IC programs in the country, with full IC submittals required on major embankment projects
- Texas DOT has implemented IC specifications on TxDOT projects with guidance for both cohesive and granular fills
- Colorado DOT requires LWD verification testing on granular base and subgrade for all CDOT projects—relevant for contractors doing dirt exchange in Boulder or dirt exchange in Denver area infrastructure work
OSHA and Safety Considerations
While OSHA's focus is on worker safety rather than material quality, compaction quality has direct safety implications. Poorly compacted trenching backfill creates unstable conditions that increase the risk of trench wall failure. Proper compaction of trench backfill, documented with testing records, is both a quality and safety requirement on most projects.
Cost-Benefit Analysis of Intelligent Compaction vs. Traditional Testing
One of the most common questions earthwork contractors ask about IC technology is whether the investment pays off. The answer, based on documented project data, is a clear yes—but the payback timeline depends on project size and type.
Upfront Costs
| Technology | Typical Cost | Notes |
|---|---|---|
| Nuclear Density Gauge | $8,000–$15,000 | Plus annual calibration, licensing fees |
| Sand Cone Test Kit | $500–$1,500 | Plus lab fees per test ($30–$75 each) |
| Light Weight Deflectometer | $15,000–$30,000 | Minimal ongoing costs |
| IC-Ready Roller (add-on system) | $25,000–$60,000 | Retrofit to existing roller |
| New IC-Equipped Roller | $200,000–$500,000+ | Full purchase, IC included |
| IC Data Management Software | $5,000–$20,000/year | Subscription-based platforms |
Documented Benefits
Reduced rework: Projects using IC have documented rework rates 30–60% lower than traditional spot-check programs, according to FHWA pooled fund study data. On a $10 million earthwork project, this can represent $300,000–$600,000 in avoided rework costs.
Reduced testing costs: IC documentation can reduce required traditional testing by 30–50% on qualifying projects (where state specifications allow), reducing nuclear gauge testing and lab costs significantly.
Faster project completion: Continuous real-time feedback allows operators to identify problem areas and add passes immediately, rather than waiting for test results. Projects using IC consistently report 10–20% reductions in compaction-related delays.
Liability protection: Complete spatial documentation of compaction effort and response provides compelling defense against future settlement claims. Several major earthwork contractors report that IC documentation has been decisive in resolving claims without litigation.
Fuel and equipment savings: IC's ability to identify when adequate compaction is achieved prevents unnecessary additional passes. Studies have documented 10–15% fuel savings on large embankment projects where IC was used to optimize pass counts.
Implementing a Compaction Monitoring Program: Step-by-Step
For contractors ready to upgrade their compaction quality control approach, here's a practical implementation framework:
Step 1: Characterize Your Project Soils
Before any monitoring program can be meaningful, you need laboratory Proctor data on the actual soils you'll be placing. Sample from borrow sources, run ASTM D698 or D1557 tests (matching the specification requirement), and establish the maximum dry density and optimum moisture content for each distinct soil type or borrow area. If you're sourcing materials from multiple locations, as is common on large projects, each source may need separate testing.
Step 2: Select Your Monitoring Method
Match your monitoring approach to project requirements and budget:
- Small projects (<$500K earthwork): Traditional nuclear gauge or LWD with systematic testing plan
- Medium projects ($500K–$5M): LWD or DCP supplemented with IC if rollers are available
- Large projects (>$5M or publicly funded): Full IC documentation with LWD verification and reduced traditional testing
Step 3: Establish IC Calibration Correlations
For IC programs, perform calibration testing early in the project—typically on a test strip of representative material. Run IC over the test strip and then perform LWD and/or nuclear gauge testing at the same locations. Develop regression correlations between IC CMV/CCV values and traditional test results. These correlations are project- and equipment-specific.
Step 4: Define Acceptance Criteria
Work with your engineer of record and owner to define IC-based acceptance criteria. Options include:
- Minimum CMV/CCV threshold — All areas must meet a minimum stiffness value
- Target value approach — Areas must meet a percentage of the average IC value achieved on the test strip
- Pass count + spot verification — A defined minimum pass count combined with spot verification at low-IC locations
Step 5: Train Operators and Field Staff
IC technology is only as good as the operators using it. Roller operators must understand how to read the onboard display, recognize problem areas, and adjust operations accordingly. Quality control staff must understand IC data files, mapping software, and how to identify areas requiring verification testing.
Step 6: Document and Submit
IC data files must be properly processed and submitted in project-specified formats. Most state DOT IC specifications require LandXML or CSV data files with GPS coordinates, IC values, roller speed, pass count, and timestamps. Develop a data management workflow that ensures IC files are captured, backed up, and processed for every production day.
The Role of Earthwork Platforms in Compaction Success
Compaction quality control begins long before the first roller pass. The quality, consistency, and suitability of fill material is a critical variable that affects every compaction monitoring outcome. A fill material that exceeds its optimum moisture content, contains excessive organics, or has inconsistent particle size distribution will fail compaction specifications regardless of the technology used to monitor it.
Contractors who understand this often find that sourcing fill from verified, geotechnically characterized sources—rather than accepting whatever is cheapest and closest—dramatically reduces their compaction challenges in the field. For earthwork teams working across the Western U.S., learning how DirtMatch works can be a practical starting point for finding fill sources that meet project soil specifications, with material information available upfront before mobilization.
Similarly, contractors with excess excavated material from projects in areas like dirt exchange in San Francisco or dirt exchange in Seattle can connect with projects needing compactable fill—turning disposal costs into revenue while helping nearby projects access quality material with known soil characteristics.
Compaction Monitoring Trends to Watch in 2026 and Beyond
Integration with BIM and Digital Twins
Building Information Modeling (BIM) is increasingly extending into earthwork, and IC data is becoming a natural input to earthwork digital twins. In 2026, several major infrastructure projects are piloting workflows where IC compaction maps are integrated into 3D project models that document the as-built condition of every fill layer—creating a permanent, queryable record of subsurface compaction quality.
Cloud-Based IC Data Management
IC data volumes are substantial—a single day of production on a major highway project can generate gigabytes of positioning and measurement data. Cloud-based IC data management platforms are emerging to handle storage, processing, visualization, and quality control review in near-real-time. Project owners, engineers, and contractors can review compaction coverage maps from anywhere, flagging issues before the next production day.
Wireless Sensor Networks in Compacted Fills
For critical earthen structures like dams, levees, and tailings facilities, embedded wireless sensor networks are being installed during construction to provide ongoing monitoring of moisture, pore pressure, and deformation throughout the structure's life. These sensors capture the long-term performance story that IC data during construction begins—creating a continuous quality record from placement through decades of service.
Autonomous Compaction Equipment
Several equipment manufacturers have demonstrated autonomous or semi-autonomous compactor operation in controlled settings. While full autonomous compaction at production scale remains several years away from widespread adoption, the directional trend is clear. Autonomous systems will rely entirely on IC-type monitoring for quality feedback, since there's no human operator to make judgment calls—making robust, reliable compaction measurement an absolute prerequisite.
Practical Tips for Maximizing Compaction Monitoring ROI
Invest in soil moisture monitoring early. The single biggest cause of compaction failures is placing material at the wrong moisture content. Integrate moisture monitoring (TDR probes, electronic moisture analyzers, or consistent field testing) into your workflow before and during placement.
Don't skip the test strip. IC calibration correlations developed on a representative test strip at the start of a project are the foundation of the entire quality program. Rushing this step undermines every data point that follows.
Train your roller operators, not just your QC staff. Operators who understand what the IC display is telling them and know how to respond will outperform those who simply follow a prescribed pass count pattern. Operator education is one of the highest-ROI investments in a compaction program.
Use IC data offensively, not just defensively. IC maps don't just document problems—they identify where you can reduce passes because compaction is already achieved, saving fuel and equipment wear.
Correlate IC to LWD, not just nuclear gauge. As specifications increasingly adopt modulus-based acceptance criteria, building your internal database of LWD–IC correlations positions you ahead of the curve for upcoming project requirements.
Maintain your equipment calibration. IC systems require periodic calibration checks, and GPS receivers must be verified for accuracy. An IC system that's drifted out of calibration produces data that looks authoritative but is misleading—potentially worse than no IC at all.
Conclusion: Compaction Monitoring as a Competitive Advantage
Soil compaction monitoring technology has evolved from a compliance checkbox into a genuine competitive differentiator for earthwork contractors. The combination of intelligent compaction, LWD verification, and data management platforms gives forward-thinking contractors the ability to document quality comprehensively, reduce rework, protect themselves from liability, and build the kind of verifiable performance record that wins repeat business from sophisticated owners.
In 2026, the gap between contractors using traditional spot-check programs and those deploying integrated IC programs is widening—in project quality, bid competitiveness, and client trust. The technology investment required to close that gap has never been more accessible, with retrofit IC systems, cloud-based data platforms, and a growing body of industry knowledge making implementation straightforward for contractors of all sizes.
Whether you're managing a small residential subdivision or a multi-year highway corridor, the principles are the same: know your soil, monitor compaction continuously, verify with calibrated spot tests, and document everything. That combination is what turns earthwork into infrastructure that lasts.
For contractors looking to optimize every aspect of their earthwork operations—from sourcing quality fill material to connecting with projects that need what you have—get started with DirtMatch to see how the platform is helping earthwork teams across the country work smarter from the first cubic yard to the last.