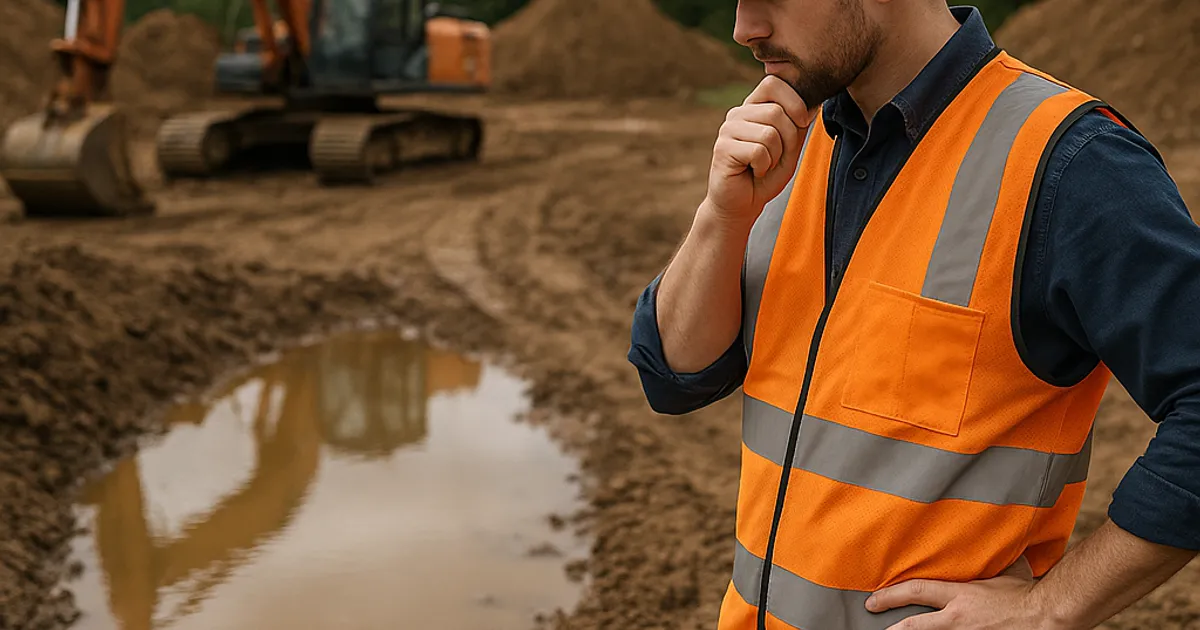
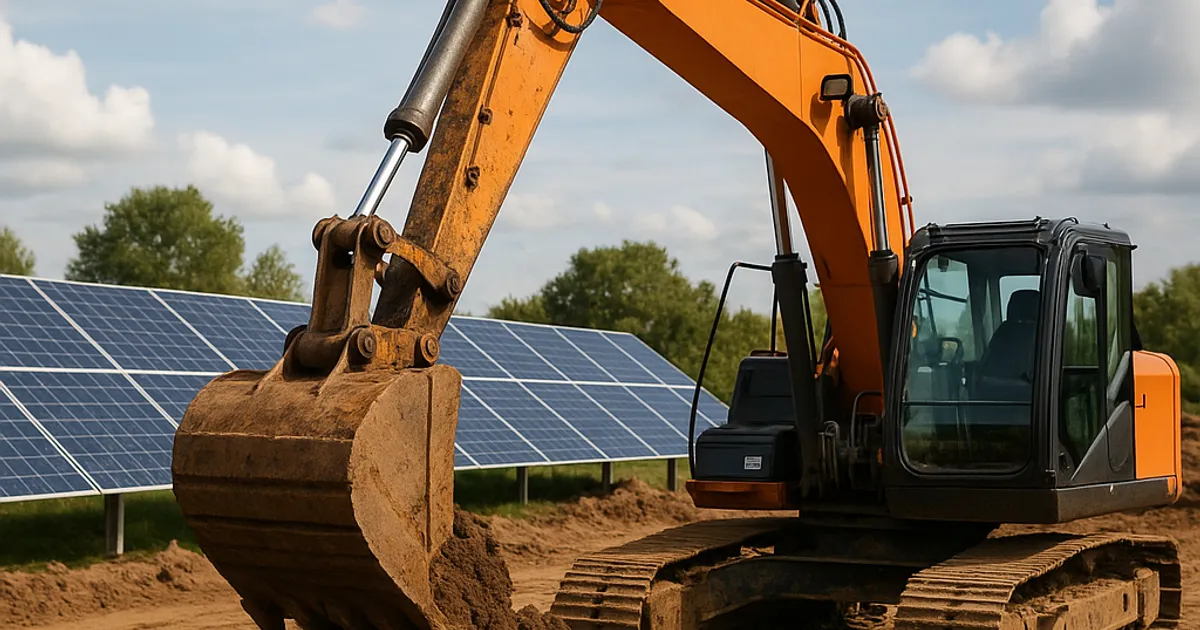
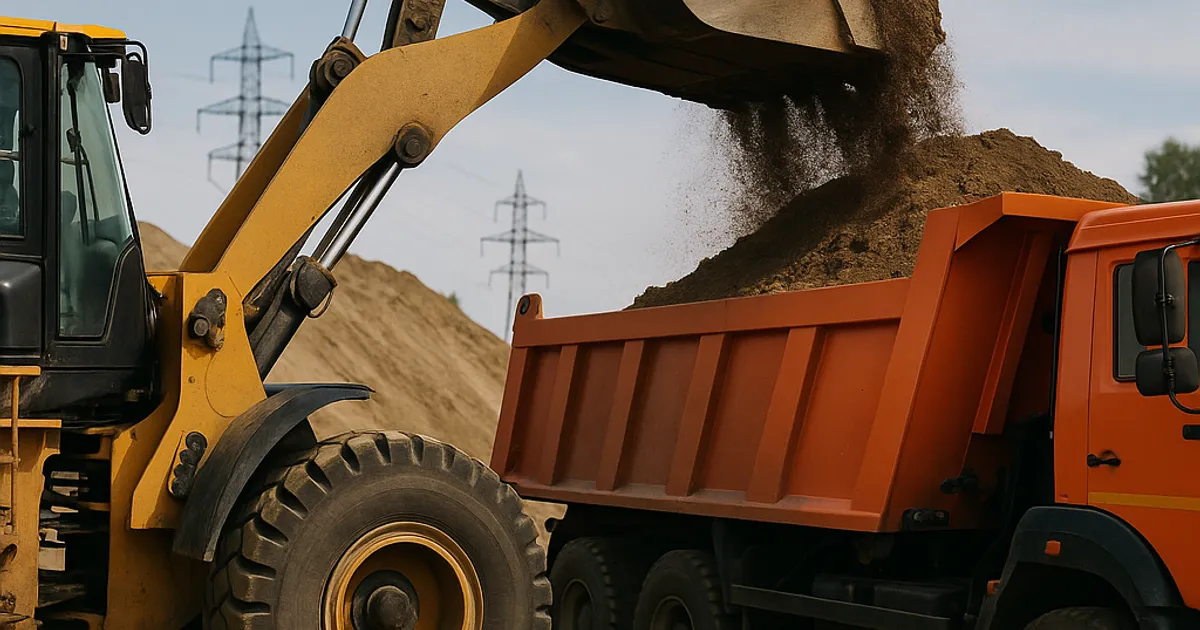
Sandy fill dirt is one of the most widely used materials in earthwork construction, grading, and site preparation projects across the United States. Its free-draining nature, relatively predictable behavior, and wide availability make it a go-to choice for contractors working on everything from residential subdivisions to large commercial pads. But sandy soil compaction is not as straightforward as it might appear. Achieve the wrong moisture content, use the wrong equipment, or skip the proper testing protocols, and you can end up with differential settlement that compromises foundations, pipelines, and roadways for decades.
This guide breaks down everything earthwork professionals need to know about sandy fill dirt compaction in 2026: the science behind it, real-world compaction rates, field and laboratory testing methods, equipment considerations, and the best practices that separate successful projects from expensive failures.
What Makes Sandy Fill Dirt Unique for Compaction
Sandy soils occupy a distinct place in the soil classification spectrum. Under the ASTM International D2487 Unified Soil Classification System (USCS), sands are categorized as coarse-grained soils where more than 50 percent of the material is retained on the No. 200 sieve. Within that broad category, you encounter well-graded sands (SW), poorly graded sands (SP), silty sands (SM), and clayey sands (SC), each behaving somewhat differently under compactive effort.
The key physical characteristic that sets sandy soils apart is their low cohesion. Clay particles bond together through electrochemical forces, giving clay soils a plasticity that allows them to be molded and shaped across a relatively wide moisture range. Sand grains, by contrast, are essentially non-plastic. Their particles interlock through friction and geometric packing rather than cohesion. This means water plays a very different role in sandy soil compaction compared to fine-grained soils.
With fine-grained soils, moisture acts as a lubricant that helps particles slide into denser arrangements, up to a peak known as optimum moisture content, beyond which excess water occupies void space and density drops. With sandy soils, the relationship between moisture and density is less pronounced. In fact, clean sands (SP) can exhibit a phenomenon called bulking, where small amounts of moisture actually cause apparent cohesion between particles, increasing void space and reducing density temporarily before compaction at higher moisture levels collapses the bulked structure.
This behavior has direct implications for field operations. A crew that checks moisture on a sandy fill and finds it slightly damp may actually be working with material that is bulked and resistant to compaction. Adding water or allowing the sand to fully saturate before compacting often yields better results than working at that intermediate moisture condition.
Key Physical Properties That Drive Compaction Performance
- Grain size distribution: Well-graded sands (SW) with a mix of particle sizes compact more efficiently than uniformly graded SP materials because finer particles fill voids between coarser ones.
- Particle shape: Angular particles from crushed stone operations interlock better than rounded river or beach sands, achieving higher densities with less compactive effort.
- Fines content: Silty sands (SM) can achieve higher maximum dry densities than clean sands because silt fills interparticle voids, but they also become more sensitive to moisture variations.
- Specific gravity: Most quartz-dominated sands have a specific gravity of approximately 2.65, which anchors density calculations used in laboratory proctor testing.
Understanding the Sand Compaction Factor
The sand compaction factor is not a single universal number. It is a ratio that describes how much a given volume of loose material will reduce in volume after compaction to a specified density. This concept is critical for estimating material quantities, truck loads, and project costs.
For sandy fill dirt, the loose-to-compacted volume ratio typically falls between 1.10 and 1.25, meaning you need 1.10 to 1.25 cubic yards of loose material to yield one compacted cubic yard. Expressed as a shrinkage or swell factor, this represents a 10 to 25 percent volume reduction during placement and compaction.
Several variables influence where a specific sandy material lands within that range:
- Initial void ratio of the loose material: Sand dumped from a truck has a relatively high void ratio. The more loosely it was placed, the greater the potential for volume reduction.
- Target compaction specification: A project specifying 95 percent of maximum dry density (Proctor) will produce a different compaction factor than one specifying 90 percent.
- Gradation and fines content: Well-graded sands compact more readily, often achieving a compaction factor near the lower end of the range, while uniform SP sands may require more effort and show higher factors.
- Layer thickness during placement: Thicker lifts require more passes and may not achieve uniform compaction throughout, affecting overall volume reduction.
For quantity takeoff and bidding purposes, most experienced earthwork contractors use a conservative compaction factor of 1.15 to 1.20 for general sandy fill. This means that a finished fill volume of 10,000 cubic yards will require sourcing approximately 11,500 to 12,000 cubic yards of loose material. Underestimating this factor is a common and costly bidding mistake.
Finding adequate volumes of quality sandy fill at a reasonable haul distance is often the first challenge contractors face. Platforms like DirtMatch connect earthwork contractors with nearby fill dirt sources, reducing hauling costs and helping teams nail their quantity estimates before the first truck rolls.
Fill Dirt Compaction Rate Standards and Specifications
Compaction specifications establish the minimum acceptable density for a fill relative to a laboratory-determined maximum. The two most common laboratory test standards are:
- ASTM D698 (Standard Proctor): Uses a 5.5-pound hammer falling 12 inches across three layers in a standard mold. Represents low to moderate compactive effort and is commonly used for general fill and embankments.
- ASTM D1557 (Modified Proctor): Uses a 10-pound hammer falling 18 inches across five layers. Represents higher compactive effort and is specified for subgrade, base course, and structural fill applications.
For sandy fill dirt, typical compaction specifications by application include:
| Application | Typical Specification | Test Standard |
|---|---|---|
| General site grading / rough fill | 90% maximum dry density | ASTM D698 |
| Structural fill under slabs | 95% maximum dry density | ASTM D1557 |
| Roadway subgrade | 95% maximum dry density | ASTM D698 or D1557 |
| Utility trench backfill | 90-95% maximum dry density | ASTM D698 |
| Embankment construction | 90-95% maximum dry density | ASTM D698 |
| Foundation support | 95-98% maximum dry density | ASTM D1557 |
Sandy soils respond well to increased compactive effort. Because they lack the plasticity of clay, they tend to achieve near-maximum density more readily, but they are also more prone to achieving density that appears acceptable at the surface while remaining loose at depth if lift thickness is not controlled.
State DOT specifications often add further requirements. Many state highway departments require sandy subgrade materials to meet specific California Bearing Ratio (CBR) values in addition to density targets, recognizing that density alone does not fully characterize the load-bearing capacity of a sandy fill.
Laboratory Testing Methods for Sandy Fill Dirt
Accurate laboratory characterization of sandy fill material is essential before field compaction begins. Skipping this step and relying on generic assumptions can lead to density specifications that are either unachievably strict or dangerously loose.
Standard and Modified Proctor Tests
The Proctor compaction test (ASTM D698 and D1557) establishes the relationship between moisture content and dry density for a specific soil. The test produces a compaction curve showing dry density on the vertical axis and moisture content on the horizontal axis. The peak of the curve identifies the maximum dry density and optimum moisture content.
For clean, well-graded sands, the compaction curve is often relatively flat, meaning density does not vary dramatically across a range of moisture contents. This is a double-edged characteristic: it provides more flexibility during field operations, but it also makes it harder to identify a clear optimum moisture target. Some clean sands show almost no discernible peak on the standard Proctor curve, which is why ASTM D4253 and D4254 (maximum and minimum index density tests) are sometimes used instead for very clean granular materials.
Maximum and Minimum Index Density Testing
ASTM D4253 (maximum index density) and D4254 (minimum index density) provide relative density bounds for clean sands. Relative density (Dr) expressed as a percentage then becomes the compaction target, replacing the percent Proctor approach. Relative density specifications of 70 to 85 percent are common for foundation support applications involving clean sandy soils.
Grain Size Analysis
ASTM D6913 (sieve analysis) characterizes the particle size distribution of the sandy fill and confirms its USCS classification. This test takes roughly two to four hours in a soils laboratory and costs between $75 and $150, making it one of the most cost-effective investments on any fill project.
Atterberg Limits
For silty sands and clayey sands, ASTM D4318 Atterberg limits testing determines plasticity index and helps predict sensitivity to moisture variations. A plasticity index above 10 in a sandy material signals enough fine-grained content to warrant closer moisture control during compaction.
Field Testing Methods: Verifying Sandy Fill Compaction in the Field
Laboratory testing establishes targets. Field testing verifies that those targets have been met after compaction. For sandy fill dirt, four field methods are commonly used:
Nuclear Density Gauge Testing
The nuclear density gauge (NDG) is the workhorse of field compaction testing. It measures both wet density and moisture content using gamma radiation and neutron emission, allowing direct calculation of dry density and percent compaction. Testing takes roughly five minutes per location and provides immediate results.
For sandy soils, nuclear gauge testing is generally reliable, but the gauge must be calibrated specifically for the material being tested. Sand correction factors are routinely applied. Typical NDG testing costs range from $25 to $60 per test when performed by a materials testing firm, or the gauge itself costs $6,000 to $10,000 for contractors who prefer to own their equipment.
Safety protocols for nuclear gauge use are governed by the Nuclear Regulatory Commission and require licensed operators. Field personnel must complete radiation safety training and adhere to strict handling procedures.
Sand Cone Test
The sand cone test (ASTM D1556) is the classic reference method for field density testing. A measured volume of calibrated Ottawa sand is poured into a hole excavated in the fill, and the volume of the hole is determined by the weight of sand required to fill it. The excavated soil is weighed and oven-dried to determine density and moisture.
The sand cone test is slower than nuclear gauge testing (taking 30 to 60 minutes per location) but is widely accepted as a check on nuclear gauge readings and is often specified as the method of record on public infrastructure projects. Cost per test ranges from $75 to $150 when performed by a testing laboratory.
Clegg Impact Soil Tester
The Clegg hammer provides a quick, economical way to assess compaction by measuring deceleration of a falling mass. It does not directly measure density or moisture content but produces a Clegg Impact Value (CIV) that correlates with CBR. It is best used for rapid pass-by-pass monitoring during compaction rather than as a final acceptance test.
Lightweight Deflectometer (LWD)
The LWD has gained significant traction in 2026 for evaluating compaction quality in sandy fill applications. It measures the dynamic deflection of a soil surface under a falling weight, producing an Evd (dynamic deformation modulus) value that correlates to stiffness. Many transportation agencies now accept LWD testing as a supplement or alternative to density-based methods, especially for granular materials where stiffness is a more direct indicator of load-bearing performance than density alone.
Equipment Selection for Compacting Sandy Fill Dirt
Choosing the right compaction equipment is as important as controlling moisture content. Sandy soils respond best to specific types of compactive effort, and using the wrong machine can result in inadequate depth of influence, surface over-compaction with loose material at depth, or inefficient use of equipment hours.
Vibratory Smooth Drum Rollers
Vibratory smooth drum rollers are the preferred choice for compacting sandy fill in most earthwork applications. The vibratory action causes sand particles to rearrange into denser configurations more effectively than static weight alone. Drum weights typically range from 8 to 20 tons, with operating frequencies between 25 and 35 Hz.
For sandy fill, the high-amplitude, low-frequency setting on a modern intelligent compaction roller often performs better than high-frequency settings, particularly for deeper lift compaction. Equipment manufacturers including Caterpillar offer intelligent compaction rollers with onboard stiffness measurement that provide real-time feedback and GPS-mapped compaction documentation, dramatically improving quality control on large earthwork projects.
Plate Compactors and Jumping Jacks
For trenches, tight spaces, and thin lifts of sandy fill adjacent to structures or utilities, plate compactors and jumping jacks (rammer compactors) are the standard tools. Plate compactors are preferred for clean sandy soils because their vibratory action suits granular materials well. Jumping jacks deliver higher impact energy and are better suited for confined areas with silty sands.
Typical plate compactor influence depth is 6 to 12 inches, which dictates maximum lift thickness in confined areas.
Walk-Behind Vibratory Rollers
For smaller fills, residential grading, and areas inaccessible to larger equipment, walk-behind vibratory rollers provide a step up in production capacity from plate compactors while maintaining maneuverability. Drum widths range from 24 to 48 inches, and operating weights from 1,000 to 3,000 pounds.
Equipment Selection Summary
| Project Scale | Recommended Equipment | Max Lift Thickness |
|---|---|---|
| Large embankment / mass grading | Vibratory smooth drum roller (10-20 ton) | 10-12 inches |
| Utility trench backfill | Jumping jack or plate compactor | 6-8 inches |
| Residential grading | Walk-behind vibratory roller | 6-8 inches |
| Confined structural areas | Electric plate compactor | 4-6 inches |
Optimal Moisture Content for Sandy Soil Compaction
Moisture management is perhaps the most misunderstood aspect of sandy fill compaction. Because clean sands have little plasticity, the concept of optimum moisture content works differently than it does for cohesive soils.
The Bulking Problem
As mentioned earlier, clean sands can exhibit bulking when moisture content rises to roughly 4 to 8 percent. At this moisture range, apparent surface tension between water films and sand grains creates a temporary cohesion that actually holds particles apart rather than helping them pack together. Field crews working sandy fill in this moisture range will struggle to achieve density even with appropriate equipment and lift thickness.
The practical solution is to either keep sandy fill as dry as possible (below 2 percent moisture) or to add enough water to fully saturate the material and eliminate the bulking effect before compacting. Many experienced contractors working with clean sands in arid climates like those common in the dirt exchange in Denver region will pre-wet sandy fill with a water truck to achieve near-saturation before rolling, achieving densities in one or two passes that would otherwise require four to six passes on damp but non-saturated material.
Moisture Content Ranges by Sand Type
| Sand Classification | Optimal Moisture Range | Notes |
|---|---|---|
| Clean well-graded sand (SW) | Less than 2% or greater than 10% | Avoid intermediate bulking range |
| Clean poorly graded sand (SP) | Dry or saturated preferred | Most susceptible to bulking |
| Silty sand (SM) | 6-14% (varies by fines content) | Standard optimum moisture applies |
| Clayey sand (SC) | 8-16% (varies by clay content) | Follow modified Proctor guidance |
Find or Post Dirt, Rock & Aggregate
Join thousands of contractors using DirtMatch to buy, sell, and exchange earthwork materials.
Try DirtMatch FreeLift Thickness and Pass Count Guidelines
Proper lift thickness control is non-negotiable for quality sandy fill compaction. Placing lifts that are too thick results in well-compacted surface material with inadequate density at depth, a condition that can pass field tests while concealing settlement-prone material below.
Recommended Lift Thicknesses
For large vibratory rollers operating at 10 to 20 tons, sandy fill lifts of 10 to 12 inches (loose) are standard. The effective depth of influence for vibratory compaction in sandy soils is roughly 1.5 times the drum diameter. Exceeding recommended lift thickness by even 25 percent can result in densities at the bottom of the lift that are 5 to 8 percentage points below target, an amount that easily constitutes a failing condition.
For plate compactors and jumping jacks, lift thickness should not exceed 6 to 8 inches of loose material. This requirement is frequently violated on utility trench projects under time pressure, contributing to the pavement settlement that appears above buried utilities within two to three years of construction.
Pass Count and Diminishing Returns
Most sandy fill materials reach near-maximum achievable density within four to eight roller passes, depending on equipment, lift thickness, and moisture condition. Additional passes beyond this point produce minimal additional density while increasing the risk of particle crushing in poorly graded sands and unnecessarily wearing equipment.
A roller pass count study at the beginning of a large earthwork project, where test strip data is collected with a nuclear gauge or LWD after each pass, is a worthwhile investment. It allows the contractor to identify the minimum pass count needed to consistently achieve specification, optimizing production rates without sacrificing quality.
Common Causes of Sandy Fill Compaction Failure
Understanding why sandy fill compaction fails is as important as knowing how to achieve it. The following failure modes appear repeatedly in geotechnical investigation reports following settlement events:
Excessive Lift Thickness
This is the single most common cause of compaction failure in sandy fill projects. Time pressure on construction schedules encourages crews to dump and roll thicker lifts, skipping the controlled placement that quality compaction requires.
Working in the Bulking Moisture Range
As detailed above, working clean sands at intermediate moisture contents produces deceptively difficult compaction conditions. Crews that add a little water thinking they are approaching optimum moisture may actually be making conditions worse.
Wrong Equipment for Soil Type
Using a pneumatic tire roller on clean granular fill, or a sheepsfoot roller on clean sand, will not achieve the density that a vibratory smooth drum roller produces. Equipment selection must match the soil type.
Inadequate Testing Frequency
Project specifications typically require one density test per lift per specified area, often one test per 2,500 to 5,000 square feet. Insufficient testing frequency allows failing areas to be covered over and discovered only later when settlement occurs.
Contamination with Fines
Sandy fill stockpiles that become contaminated with clay or silt during handling show dramatically different compaction behavior than the lab-tested material. Visual inspection of stockpiles and periodic re-testing when gradation appears to have changed are important quality control steps.
Regulatory and Environmental Considerations
Sandy fill compaction does not occur in a regulatory vacuum. Projects involving significant earthwork are subject to stormwater discharge permitting, soil disturbance notifications, and in some jurisdictions, fill placement regulations.
For projects near waterways or wetlands, the Army Corps of Engineers Regulatory Program governs fill placement under Section 404 of the Clean Water Act. Sandy fill placed in jurisdictional wetlands without proper authorization can trigger significant enforcement action and remediation requirements.
Stormwater management during large sandy fill operations deserves special attention. Sandy soils are inherently erodible, and disturbed sandy fill areas on construction sites are significant contributors to stormwater sediment loading. Projects over one acre of disturbance require a Stormwater Pollution Prevention Plan (SWPPP) under EPA National Pollutant Discharge Elimination System (NPDES) regulations.
Proper erosion control measures including silt fences, sediment basins, and stabilized construction entrances must be installed and maintained throughout fill placement and compaction operations. This is not only a regulatory requirement but also a practical protection for the compaction work itself: eroded sandy fill must be replaced and re-compacted at additional cost.
Cost Considerations for Sandy Fill Compaction Projects
Accurate cost estimation for sandy fill compaction requires accounting for material, transport, placement, and testing components. Here is a realistic breakdown of typical 2026 cost ranges for sandy fill compaction operations in the continental United States:
| Cost Component | Typical Range (per compacted CY) |
|---|---|
| Sandy fill material (at source) | $3 to $12 |
| Hauling (per mile per CY) | $0.25 to $0.60 |
| Placement and compaction labor/equipment | $4 to $9 |
| Compaction testing (materials testing firm) | $0.50 to $2 |
| Total (excluding haul distance variables) | $8 to $25+ |
Haul distance is often the dominant cost driver on sandy fill projects. A contractor paying $5 per cubic yard for material at the source but hauling 25 miles may spend $15 to $20 per cubic yard in transport alone, making the total landed cost highly sensitive to source location.
This is precisely where smart sourcing makes a material difference. Contractors using DirtMatch Pro can access verified local fill dirt sources, compare material specifications, and reduce average haul distances substantially, translating directly to lower project costs and more competitive bids.
Best Practices Summary for Sandy Fill Dirt Compaction
Drawing together the technical guidance above, the following best practices represent the current industry standard for sandy fill compaction in 2026:
Classify the material first. Run a sieve analysis (ASTM D6913) and confirm USCS classification before beginning compaction design. Do not assume all sandy fill behaves the same.
Select the right compaction test method. Use Standard or Modified Proctor (ASTM D698/D1557) for silty and clayey sands. Use relative density testing (ASTM D4253/D4254) for clean SP sands with little or no fines.
Manage moisture aggressively. For clean sands, avoid the bulking moisture range of approximately 4 to 8 percent. Work dry or add water to approach saturation before compacting.
Control lift thickness strictly. Do not exceed 10 to 12 inches for large rollers or 6 to 8 inches for smaller compactors. Use lift thickness control as a non-negotiable field standard.
Use vibratory compaction equipment. Vibratory smooth drum rollers outperform static and pneumatic tire equipment on granular sandy fills in nearly every application.
Conduct a roller pass count study. Establish the optimum pass count for your specific material and equipment combination at the start of the project through a controlled test strip.
Test frequently and document thoroughly. Maintain one test per lift per specified area at minimum. Use GPS-mapped compaction documentation where available through intelligent compaction technology.
Apply a realistic compaction factor. Use 1.15 to 1.20 for quantity estimates on sandy fill. Revisit this factor if gradation or fines content varies significantly across source material.
Plan for stormwater control from day one. Eroded sandy fill is wasted compaction effort and a regulatory liability.
Source material strategically. Haul distance is the primary cost lever on sandy fill projects. Teams that use the DirtMatch platform to match with nearby sandy fill sources consistently report lower total project costs and faster mobilization timelines.
Regional Considerations for Sandy Fill Compaction
Geography plays a meaningful role in sandy fill compaction logistics, material availability, and regulatory requirements. In coastal markets like those served by the dirt exchange in San Diego and dirt exchange in Los Angeles, naturally occurring sandy soils are abundant, but expansive clay contamination in stockpiles is a constant concern. Projects in these markets benefit from rigorous incoming material testing before acceptance.
In the Mountain West, including the dirt exchange in Denver region, high elevation projects with thin-lift sandy fills face freeze-thaw cycling that can disrupt compacted fill during construction windows. Scheduling compaction operations to avoid freeze conditions and protecting freshly compacted lifts from frost penetration are important cold-weather considerations.
In the Pacific Northwest, including the dirt exchange in Seattle area, high annual rainfall creates persistent moisture management challenges for sandy fill operations. Pre-wetting to overcome bulking is rarely necessary in Seattle, but controlling excess moisture through drainage management and covering stockpiles during rain events is critical to maintaining workable conditions.
Understanding regional soil characteristics, climate constraints, and local regulatory requirements allows contractors to plan more realistic project schedules and develop more competitive bids.
Conclusion
Sandy fill dirt compaction is a discipline that rewards preparation, precision, and systematic quality control. The unique physical behavior of sandy soils, particularly the bulking phenomenon and the relatively flat moisture-density relationship of clean sands, means that field crews cannot simply apply the same techniques that work well on clay fills and expect equivalent results.
By classifying material properly, selecting the right laboratory and field test methods, controlling moisture and lift thickness rigorously, and deploying appropriate compaction equipment, contractors can consistently achieve specification densities, avoid costly settlement events, and build a reputation for quality that wins repeat business.
Material sourcing strategy is equally important. The best compaction plan in the world falls apart if sandy fill must be hauled from an inefficient distance or if incoming material quality is inconsistent. Getting started with DirtMatch gives earthwork contractors and project owners a direct connection to vetted local fill sources, compaction-ready sandy materials, and the network intelligence to make smarter sourcing decisions on every project.