The trucking industry moves the American economy. According to the American Trucking Associations (ATA), trucks haul approximately 72.5% of all freight transported in the United States, generating over $940 billion in gross freight revenues annually. Yet despite this massive scale, profit margins in trucking are notoriously thin — hovering between 3% and 6% for most fleets — making the difference between a thriving operation and a failing one often come down to how well a company understands and manages its own performance data.
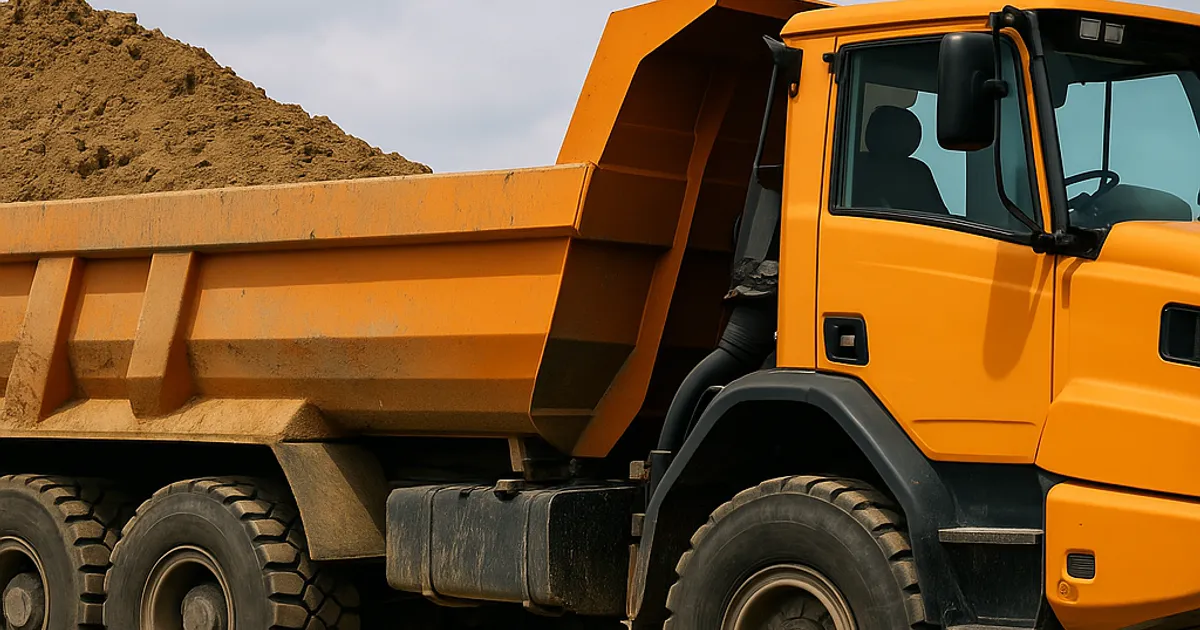
For trucking businesses that specialize in hauling earthwork materials — dirt, rock, aggregate, fill, topsoil, and construction debris — the stakes are even higher. Project timelines are rigid, material specifications must be precise, and fuel costs fluctuate wildly. In this environment, gut instinct isn't enough. You need Key Performance Indicators (KPIs).
KPIs are quantifiable measurements that reflect how effectively a company is achieving its key business objectives. In trucking, they translate operational complexity into actionable numbers. The right KPIs tell you whether you're making money on each load, whether your drivers are performing safely and efficiently, whether your trucks are working or sitting idle, and whether your customers are staying loyal.
This guide covers the most critical KPIs every trucking business should monitor, with industry benchmarks, calculation formulas, red flags to watch for, and practical strategies to move the needle in the right direction.
Why KPIs Are the Backbone of a Profitable Trucking Business
Before diving into specific metrics, it's worth understanding why KPI tracking is non-negotiable for serious trucking operators. A 2022 survey by the Federal Motor Carrier Safety Administration (FMCSA) found that smaller carriers — those with fewer than 20 trucks — are disproportionately represented in business failures, often citing poor financial visibility and operational inefficiency as root causes. Larger, more successful fleets, by contrast, consistently invest in fleet management software, telematics, and performance dashboards.
The reason is simple: what gets measured gets managed. When you know your cost-per-mile down to the cent, you can price loads accurately. When you track idle time by driver and by route, you can eliminate waste. When you monitor on-time delivery rates, you can identify bottlenecks before they cost you a contract.
For earthwork and construction hauling companies specifically, KPI tracking offers additional advantages:
- Load matching efficiency: Knowing your average haul distance and empty-mile percentage helps you evaluate whether platforms and brokers are delivering value.
- Material-specific cost analysis: Hauling wet clay costs more in fuel than hauling dry aggregate. KPIs help you price accordingly.
- Project profitability tracking: Construction projects have defined scopes. Tracking KPIs per project reveals which jobs make money and which don't.
- Regulatory compliance: DOT hours-of-service (HOS) compliance is a KPI in itself, with violations carrying fines up to $16,000 per incident under 49 CFR Part 395.
Establishing a KPI dashboard is not a one-time exercise. It requires consistent data collection, regular review cadences (weekly, monthly, quarterly), and a culture of accountability where drivers, dispatchers, and managers all understand the numbers that drive the business.
Financial KPIs: Understanding the Numbers That Keep the Lights On
Financial KPIs are the foundation of any trucking business performance system. They answer the most fundamental question: are we making money?
Cost Per Mile (CPM)
Cost Per Mile is arguably the single most important financial KPI in trucking. It tells you exactly what it costs to move a truck one mile, allowing you to set rates, evaluate lanes, and benchmark against competitors.
Formula: Total Operating Costs ÷ Total Miles Driven
Operating costs include fuel, driver wages, maintenance, insurance, tires, tolls, permits, depreciation, and overhead allocation. According to the ATA's American Trucking Trends report, the average cost per mile for a truckload carrier in 2023 was approximately $1.85 to $2.10 per mile for large fleets, and $2.20 to $2.60 per mile for smaller owner-operators when accounting for all true costs.
For dump truck operators hauling earthwork materials, CPM can be significantly higher due to heavier loads, slower average speeds, more frequent stops, and higher tire wear. Many earthwork haulers find their true CPM is $2.80 to $3.50 or more per loaded mile, which is why accurately calculating this number — not guessing — is critical to profitable bidding.
Red flags: If your CPM is rising quarter-over-quarter without a corresponding increase in rates, you're on a collision course with unprofitability.
Revenue Per Mile (RPM)
Revenue Per Mile measures how much money you bring in for every mile your trucks travel — including both loaded and empty miles.
Formula: Total Revenue ÷ Total Miles Driven (loaded + empty)
The gap between RPM and CPM is your per-mile margin. Industry benchmark for a healthy operation is an RPM that exceeds CPM by at least 15-20%. For dump truck operations in competitive earthwork markets, achieving strong RPM often requires minimizing empty miles — which is exactly where load-matching technology pays dividends.
Operating Ratio (OR)
The Operating Ratio is a critical financial health metric that expresses operating expenses as a percentage of revenue.
Formula: (Total Operating Expenses ÷ Total Revenue) × 100
An operating ratio below 93 is generally considered healthy in trucking (meaning you're keeping at least 7 cents of every dollar). Best-in-class carriers target an OR below 85. An OR above 100 means you're losing money on operations before accounting for debt service or taxes.
Fuel Cost as a Percentage of Revenue
Fuel typically represents 25-35% of total operating costs for trucking companies. Tracking fuel spend as a percentage of revenue helps you understand how diesel price volatility is impacting your margins and whether fuel surcharge programs are adequately compensating.
Industry benchmark: Fuel costs should represent no more than 28-32% of gross revenue for a well-managed fleet.
Operational Efficiency KPIs: Getting More from Every Truck and Driver
Operational KPIs measure how productively your assets and people are being used. Inefficiency in trucking is extraordinarily expensive — an idle truck is a depreciating asset generating zero revenue.
Truck Utilization Rate
Truck Utilization Rate measures what percentage of available working time your trucks are actually generating revenue.
Formula: (Loaded Miles ÷ Total Available Miles) × 100
A utilization rate below 70% suggests significant idle time, unscheduled downtime, or poor load planning. Best-in-class fleets target 80-85% utilization. For dump truck operators on construction projects, utilization can be cyclical — high during active project phases, low during mobilization and demobilization — so tracking this KPI over rolling 30 and 90-day windows gives a more accurate picture than snapshot measurements.
Empty Mile Percentage
Empty miles — also called deadhead miles — are trips where your truck is running without a paying load. They represent pure cost with zero revenue.
Formula: (Empty Miles ÷ Total Miles) × 100
The national average empty mile percentage for truckload carriers is approximately 28-35%, but for dump truck operators in earthwork, the nature of point-to-point hauls (excavation site to dump site, quarry to job site) can drive empty miles even higher without active load matching.
Reducing empty miles by even 5-10 percentage points can dramatically improve profitability. This is one area where technology-driven load matching makes a measurable difference. Platforms like DirtMatch connect earthwork haulers with nearby fill dirt sources and project opportunities, helping operators find backhaul loads and reduce costly deadhead runs between job sites.
Loads Per Truck Per Day
For dump truck operations, the number of loads completed per truck per day is a high-frequency operational KPI that directly correlates to daily revenue.
Formula: Total Loads ÷ Active Trucks ÷ Working Days
This varies significantly by haul distance. Short-cycle operations (hauls under 10 miles) may achieve 8-12 loads per truck per day, while longer hauls (20-40 miles) might yield only 3-6 loads. Tracking this KPI by route and project type helps you identify where operational bottlenecks — waiting time at loading sites, scale lines, dump sites — are eating into your daily cycle counts.
On-Time Delivery Rate
On-time delivery measures what percentage of loads arrive at their destination within the contracted or committed time window.
Formula: (On-Time Deliveries ÷ Total Deliveries) × 100
For construction material hauling, on-time delivery is directly tied to project schedules. A concrete pour can't wait for aggregate that's running two hours late. Missing delivery windows not only damages customer relationships but can trigger penalty clauses in contracts. Industry best practice targets an on-time delivery rate of 95% or higher.
Driver Performance KPIs: Your Most Valuable and Most Variable Asset
Drivers represent both the highest cost and the highest value component of most trucking operations. Driver wages and benefits typically account for 25-35% of operating costs, and driver behavior directly impacts fuel efficiency, safety, maintenance costs, and customer satisfaction.
Driver Retention Rate
The trucking industry has faced a chronic driver shortage for years. The ATA estimates the industry is short approximately 60,000 drivers, with turnover rates at large truckload carriers exceeding 90% annually. For smaller earthwork hauling companies, turnover is often lower but still costly — replacing a driver can cost $5,000 to $15,000 when accounting for recruiting, onboarding, training, and lost productivity.
Formula: ((Drivers at End of Period - New Hires During Period) ÷ Drivers at Start of Period) × 100
Target a retention rate above 80% annually. Track this by tenure cohort (new hires vs. experienced drivers) to understand where attrition is occurring.
Miles Per Gallon (MPG) by Driver
Fuel efficiency varies significantly by driver behavior. Studies by the Oak Ridge National Laboratory have found that driver behavior — speed, acceleration, braking, idle time — accounts for up to 30% of fuel consumption variance between drivers operating identical equipment on similar routes.
Tracking MPG by driver allows you to identify top performers, target coaching for underperformers, and calculate the real cost of poor driving habits. A 1 MPG improvement across a 10-truck fleet running 100,000 miles per year saves roughly $35,000-$40,000 in fuel annually at current diesel prices.
Safety Score and Incident Rate
Safety KPIs are both a legal obligation and a financial imperative. FMCSA's Safety Measurement System (SMS) scores carriers on seven Behavioral Analysis and Safety Improvement Categories (BASICs), including unsafe driving, hours-of-service compliance, vehicle maintenance, and controlled substances.
Track these internal safety KPIs:
- Preventable accident rate: Accidents per million miles driven
- HOS violation rate: Percentage of inspections resulting in HOS citations
- CSA score by BASIC category: Monitor monthly for deteriorating trends
A single preventable accident involving property damage averages $91,000 in total costs, according to the Federal Motor Carrier Safety Administration. Fatality-involved accidents carry average costs exceeding $3.6 million when litigation is included.
Driver Idle Time
Idle time — engine running without vehicle movement — is a significant but often invisible cost center. According to the U.S. Department of Energy, a commercial truck burns approximately 0.8 gallons of diesel per hour while idling. For a 10-truck fleet averaging 2 hours of idle time per truck per day, that's 5,840 gallons wasted annually — roughly $20,000+ at current diesel prices, before factoring in increased engine wear.
Target idle time below 10% of total engine-on time. Telematics systems from providers like Samsara, Verizon Connect, and Motive make tracking this at the individual driver level straightforward.
Asset Management KPIs: Maximizing Equipment Life and Minimizing Downtime
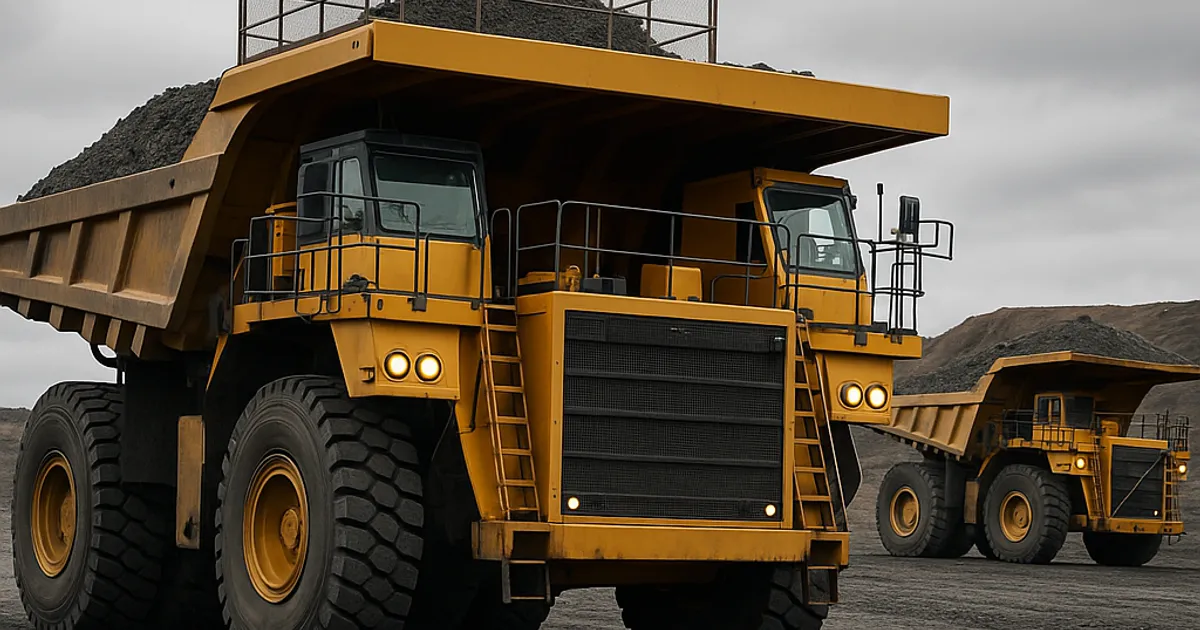
Trucks are your most capital-intensive assets. A new Class 8 dump truck costs $150,000 to $200,000, and maintenance decisions can mean the difference between a 15-year productive lifespan and a 7-year money pit.
Preventive Maintenance Compliance Rate
Preventive maintenance (PM) compliance measures what percentage of scheduled maintenance events are completed on time.
Formula: (On-Time PM Completions ÷ Total Scheduled PMs) × 100
Target 95%+ compliance. Deferred maintenance is one of the most common drivers of catastrophic failures and DOT out-of-service orders. A truck placed out of service during a CVSA roadside inspection costs an average of $1,200 per day in lost revenue plus repair costs.
Unplanned Downtime Rate
Unplanned downtime measures the percentage of available working days lost to unexpected breakdowns.
Formula: (Unplanned Downtime Hours ÷ Total Available Hours) × 100
Best-in-class fleets target less than 2% unplanned downtime. Track this by vehicle age, make/model, and mileage to build a data-driven replacement cycle rather than guessing when to trade in aging equipment.
Maintenance Cost Per Mile
Maintenance costs grow predictably as trucks age. Tracking maintenance cost per mile allows you to model when a truck transitions from an asset to a liability.
Industry benchmarks by truck age:
| Truck Age | Average Maintenance CPM |
|---|---|
| 0-2 years | $0.08 - $0.12 |
| 3-5 years | $0.14 - $0.20 |
| 6-8 years | $0.22 - $0.32 |
| 9+ years | $0.35 - $0.55+ |
When maintenance CPM exceeds the cost of financing a newer truck, replacement becomes financially rational.
Tire Cost Per Mile
Tires are the second-largest maintenance expense for dump trucks after engine and drivetrain. A full set of tires on a tandem-axle dump truck costs $3,000 to $5,000, and improper inflation alone can reduce tire life by 25%.
Track tire cost per mile by vehicle and enforce a rigorous pre-trip inspection protocol that includes tire pressure checks. Implement a tire pressure monitoring system (TPMS) across your fleet — the ROI is typically achieved within 12-18 months through improved fuel economy and extended tire life.
Customer and Revenue KPIs: Building a Business That Lasts
Financial sustainability requires not just managing costs but growing and retaining revenue. Customer-focused KPIs help you understand the health of your revenue base.
Customer Retention Rate
Retaining existing customers is 5-7x cheaper than acquiring new ones. For earthwork hauling companies, long-term relationships with general contractors, developers, and public works agencies are the lifeblood of the business.
Formula: ((Customers at End of Period - New Customers Acquired) ÷ Customers at Start of Period) × 100
Target 85%+ annual retention. Track reasons for customer attrition systematically — whether it's pricing, service failures, or competitive poaching — so you can address root causes.
Revenue Concentration Risk
If your top three customers represent more than 50% of your total revenue, you have dangerous concentration risk. The loss of a single major customer could be existential. Monitor this metric quarterly and actively pursue diversification.
Average Revenue Per Customer
Track revenue per customer over time. Growing average revenue per customer — through expanded scope, additional truck deployments, or rate increases — is more efficient than constantly acquiring new accounts.
Load Acceptance Rate and Lane Profitability
Not all loads are profitable. Track acceptance rate by lane, customer, and material type to understand which opportunities align with your cost structure. Some lanes that look attractive at face value become money losers when empty miles, permit costs, and wait times are factored in.
For operators moving fill dirt, topsoil, or aggregate in high-activity construction markets, platforms that provide transparent lane data and project visibility can significantly improve load quality. Understanding how DirtMatch works can help earthwork haulers access better-quality load opportunities matched to their specific equipment and geographic footprint.
Find or Post Dirt, Rock & Aggregate
Join thousands of contractors using DirtMatch to buy, sell, and exchange earthwork materials.
Try DirtMatch FreeCompliance and Safety KPIs: Protecting Your Operating Authority
For any motor carrier, the operating authority granted by the FMCSA is the license to do business. Losing it — through safety rating deterioration, repeated HOS violations, or a DOT audit — means the business is over. Compliance KPIs protect this existential asset.
CSA BASIC Scores
FMCSA's Compliance, Safety, Accountability (CSA) program assigns scores in seven BASICs based on inspection and crash data from the previous 24 months. Scores above intervention thresholds (which vary by BASIC, typically 65-80th percentile) attract FMCSA attention and can disqualify you from working with safety-conscious shippers and general contractors.
Monitor your CSA scores monthly at FMCSA's Safety Measurement System portal. Address violations systematically — a single HOS violation stays in your SMS data for 24 months.
Hours of Service Compliance Rate
ELD mandates under 49 CFR Part 395 have made HOS violations more visible and harder to mask. Track HOS violations per driver per month and establish zero-tolerance policies for logbook falsification. Beyond regulatory risk, HOS violations signal driver fatigue — a safety risk that costs lives and exposes your business to catastrophic liability.
Inspection Pass Rate
Monitor the percentage of CVSA roadside inspections that result in no violations or driver/vehicle out-of-service orders.
Formula: (Clean Inspections ÷ Total Inspections) × 100
Industry average clean inspection rate is approximately 78%. Best-in-class carriers achieve 90%+. A systematic pre-trip inspection program, enforced through daily driver vehicle inspection reports (DVIRs) and periodic shop inspections, is the primary driver of improved inspection outcomes.
Technology and Data Infrastructure: Building Your KPI Dashboard
Tracking all of these KPIs manually is neither practical nor scalable. The modern trucking operation needs a layered technology stack that captures data automatically and surfaces it in actionable dashboards.
Essential Technology Components
Telematics/ELD Platform: Providers like Samsara, Motive (formerly KeepTruckin), and Verizon Connect automatically capture GPS location, speed, idle time, MPG, HOS data, and DVIR information. Monthly costs range from $25-$75 per truck but deliver ROI through fuel savings, compliance risk reduction, and insurance discounts (many insurers offer 5-15% premium reductions for telematics-equipped fleets).
Transportation Management System (TMS): A TMS manages dispatch, load assignments, invoicing, and customer communications. For smaller fleets, solutions like Axon, Rose Rocket, or Trucking Office provide comprehensive functionality at $100-$300 per month.
Accounting/Financial Software: QuickBooks with trucking-specific integrations, or purpose-built trucking accounting platforms, enable accurate CPM and OR calculations by integrating fuel card data, payroll, and accounts receivable.
Load Matching Platforms: For earthwork haulers specifically, connecting with project opportunities efficiently is a KPI in itself. DirtMatch provides a specialized marketplace connecting dump truck operators with earthwork projects involving fill dirt, rock, and aggregate — reducing the time and cost of finding quality loads that match your equipment and location.
Building Your KPI Review Cadence
Data is only valuable if it drives decisions. Establish a disciplined review cadence:
| Review Frequency | KPIs to Review |
|---|---|
| Daily | Loads completed, on-time delivery, HOS status, fuel consumed |
| Weekly | Revenue per truck, idle time, maintenance issues, driver performance |
| Monthly | CPM, RPM, OR, safety scores, customer satisfaction, retention |
| Quarterly | Full P&L by lane/customer, asset utilization, driver retention, CSA trends |
| Annually | Strategic KPI benchmarking, equipment replacement planning, rate structure review |
Benchmarking Your KPIs: How Do You Stack Up?
KPIs are most powerful when viewed in context. Comparing your metrics against industry benchmarks identifies gaps and quantifies improvement opportunities.
Comprehensive KPI Benchmark Table
| KPI | Below Average | Industry Average | Best in Class |
|---|---|---|---|
| Operating Ratio | >95 | 88-93 | <85 |
| Cost Per Mile | >$2.60 | $2.00-$2.40 | <$1.85 |
| Empty Mile % | >35% | 28-35% | <20% |
| Truck Utilization | <65% | 70-75% | >82% |
| Driver Retention | <70% | 75-80% | >88% |
| On-Time Delivery | <88% | 92-95% | >97% |
| Preventive Maint. Compliance | <80% | 85-90% | >95% |
| Unplanned Downtime | >5% | 2-4% | <1.5% |
| Fuel % of Revenue | >35% | 28-32% | <25% |
| Clean Inspection Rate | <70% | 78-83% | >90% |
Sources: ATA Trucking Activity Report, ATRI Operational Costs of Trucking, FMCSA SMS Data
For earthwork haulers operating in dynamic construction markets — particularly in high-growth metros like Denver, Los Angeles, and Seattle — benchmarking against regional peers is also valuable. If you're operating a dirt exchange in Denver or managing aggregate hauls in the Pacific Northwest, local market conditions like traffic congestion, permit requirements, and project seasonality will affect your KPIs differently than national averages suggest.
Strategies to Improve Your Most Impactful KPIs
Identifying KPI gaps is step one. Closing them requires targeted strategies. Here are the highest-leverage improvement levers for trucking and earthwork hauling businesses.
Reducing Empty Miles
Empty miles are pure waste. The most effective strategies to reduce deadhead:
- Join load-matching networks specific to your material type and region. General freight boards are rarely optimal for dump trucks hauling earthwork materials.
- Develop complementary customer relationships: If you're hauling fill dirt away from an excavation site, develop relationships with construction sites that need fill — creating a natural material exchange loop.
- Coordinate with other local haulers: Informal cooperation with other dump truck operators on complementary lanes can reduce empty miles for everyone.
- Optimize dispatch routing: Advanced routing software can identify opportunities to chain loads sequentially, reducing repositioning miles.
Improving Fuel Efficiency
- Driver coaching programs: Use telematics data to identify and coach drivers with poor fuel economy. Even a 10% improvement across the fleet can save $15,000-$40,000 annually for a 10-truck operation.
- Speed policy enforcement: Every 1 MPH reduction in average highway speed improves fuel economy by approximately 0.1-0.2 MPG.
- Proper tire inflation: Under-inflated tires increase fuel consumption by up to 3% per 10 PSI below recommended pressure.
- Idle time reduction: Implement anti-idle policies and use APUs (Auxiliary Power Units) or idle management systems to reduce unnecessary idling.
Strengthening Driver Retention
Given the cost of driver turnover, improving retention delivers immediate financial ROI:
- Competitive compensation benchmarking: Audit your pay structure against regional market rates quarterly.
- Predictable home time: Earthwork hauling is often regional — leverage this to offer consistent home-daily schedules, a major retention driver.
- Performance-based incentives: Tie bonus pay to safety scores, fuel efficiency, and on-time delivery — creating shared investment in KPI outcomes.
- Transparent communication: Drivers who understand company KPIs and their personal contribution to them report higher job satisfaction.
Winning Better Loads and Projects
Revenue quality matters as much as revenue volume. Targeting better-fit projects — those with shorter empty-mile implications, higher material density, and favorable loading/dumping logistics — improves multiple KPIs simultaneously.
For earthwork haulers looking to access higher-quality project opportunities, get started with DirtMatch to connect your fleet with a specialized marketplace of fill dirt, aggregate, and excavation projects matched to your equipment, location, and availability. Better loads mean better KPIs across the board.
Setting KPI Goals: The SMART Framework for Trucking
Once you've established your baseline KPIs, setting improvement goals requires structure. The SMART framework — Specific, Measurable, Achievable, Relevant, Time-bound — prevents vague aspirations from masquerading as strategy.
Example SMART KPI Goals for a 10-Truck Dump Truck Operation:
- Specific: Reduce empty mile percentage from 32% to 24%
- Measurable: Track via telematics platform weekly
- Achievable: Based on analysis of 3 identified lane opportunities
- Relevant: Empty miles are the #1 driver of our above-benchmark CPM
- Time-bound: Achieve within 90 days
Document your KPI goals, assign ownership (who is accountable for each metric), and review progress formally in monthly management meetings. Goals without accountability are wishes.
The KPI-Profitability Connection: Putting It All Together
Individual KPIs don't exist in isolation — they interact in complex ways. Understanding these connections helps you prioritize where to focus improvement energy.
The KPI Value Chain for Earthwork Hauling:
- Better driver retention → more experienced drivers → better fuel efficiency and safety scores
- Lower empty miles → higher truck utilization → higher revenue per mile
- Better preventive maintenance compliance → lower unplanned downtime → higher loads per truck per day
- Higher on-time delivery rate → better customer retention → more stable, predictable revenue
- Improved operating ratio → stronger cash flow → ability to invest in fleet modernization → lower maintenance costs
The companies that win in trucking — especially in the specialized earthwork hauling segment — are those that see their business as an interconnected system of metrics, not a collection of isolated transactions.
As you build out your KPI tracking capability, look for partners and platforms that help you improve multiple metrics simultaneously. From reducing empty miles to finding better-matched project opportunities in your region, the right tools and networks compound your operational improvements into sustainable competitive advantage.
Conclusion: Data-Driven Trucking Wins
The road to a profitable, sustainable trucking business is paved with data. The KPIs outlined in this guide — from cost per mile and operating ratio to driver retention and CSA scores — provide the instrumentation you need to navigate the challenges of the trucking industry with confidence and precision.
Start with the fundamentals: calculate your true cost per mile, measure your empty mile percentage, and track your operating ratio. Then layer in driver performance, asset management, and customer metrics as your data infrastructure matures. Benchmark against industry standards, set SMART goals, and build a culture where every driver and dispatcher understands how their daily decisions connect to the numbers that determine whether the business thrives.
For earthwork haulers, the opportunity is particularly compelling. Construction activity remains strong across the country, demand for dirt, rock, and aggregate hauling continues to grow, and operators who bring professional-grade performance management to what has historically been an informal industry will capture disproportionate market share.
The data is there. The tools exist. The only question is whether you're willing to measure, manage, and improve with the discipline the modern trucking market demands.